confusion_matrix_at_thresholds#
- sklearn.metrics.confusion_matrix_at_thresholds(y_true, y_score, pos_label=None, sample_weight=None)[Quelle]#
Berechnet für jede Klassifizierungsschwelle Terme der binären Verwirrmatrix.
Lesen Sie mehr im Benutzerhandbuch.
Hinzugefügt in Version 1.8.
- Parameter:
- y_truendarray mit Form (n_samples,)
Wahre Zielwerte der binären Klassifizierung.
- y_scorendarray der Form (n_samples,)
Geschätzte Wahrscheinlichkeiten oder Ausgabe einer Entscheidungsfunktion.
- pos_labelint, float, bool oder str, Standardwert=None
Das Label der positiven Klasse.
- sample_weightarray-like der Form (n_samples,), Standardwert=None
Stichprobengewichte.
- Gibt zurück:
- tnsndarray der Form (n_thresholds,)
Eine Zählung von wahren Negativen. An Index
iist dies die Anzahl negativer Stichproben, denen einscore < thresholds[i]zugewiesen wurde.- fpsndarray der Form (n_thresholds,)
Eine Zählung von falschen Positiven. An Index
iist dies die Anzahl negativer Stichproben, denen einscore >= thresholds[i]zugewiesen wurde. Die Gesamtzahl der negativen Stichproben entsprichtfps[-1].- fnsndarray der Form (n_thresholds,)
Eine Zählung von falschen Negativen. An Index
iist dies die Anzahl positiver Stichproben, denen einscore < thresholds[i]zugewiesen wurde.- tpsndarray der Form (n_thresholds,)
Eine steigende Zählung von wahren Positiven. An Index
iist dies die Anzahl positiver Stichproben, denen einscore >= thresholds[i]zugewiesen wurde. Die Gesamtzahl der positiven Stichproben entsprichttps[-1].- thresholdsndarray der Form (n_thresholds,)
Abnehmende Score-Werte.
Siehe auch
confusion_matrixBerechnet die Klassifizierungsmatrix zur Auswertung der Genauigkeit eines Klassifikators.
roc_curveBerechnen Sie die Receiver Operating Characteristic (ROC)-Kurve.
precision_recall_curveBerechnet die Precision-Recall-Kurve.
det_curveBerechnet die Detection Error Tradeoff (DET) Kurve.
Beispiele
>>> import numpy as np
>>> from sklearn.metrics import confusion_matrix_at_thresholds
>>> y_true = np.array([0., 0., 1., 1.])
>>> y_score = np.array([0.1, 0.4, 0.35, 0.8])
>>> tns, fps, fns, tps, thresholds = confusion_matrix_at_thresholds(y_true, y_score)
>>> tns
array([2., 1., 1., 0.])
>>> fps
array([0., 1., 1., 2.])
>>> fns
array([1., 1., 0., 0.])
>>> tps
array([1., 1., 2., 2.])
>>> thresholds
array([0.8 , 0.4 , 0.35, 0.1 ])
Galeriebeispiele#
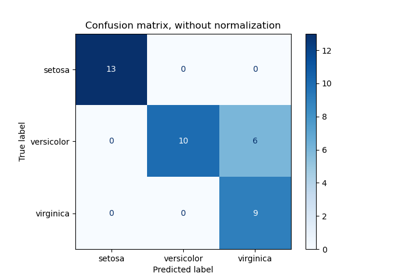
Leistung eines Klassifikators mit Konfusionsmatrix bewerten